- knowing which type of error you have
- choosing the right tool/technique to fix it
- using AI debugging best practices
General Best Practices
- use advanced models for bug fixing
- be specific when prompting the AI (use images, what’s working, what’s not working, etc)
- use checkpoints to create “backups” of your codebase
- if you notice the AI is getting stuck, revert to a previous checkpoint and try different approach
For more on debugging workflow, check out our comprehensive debugging flow chart.
Fix Lint/Compile Errors
Lint/compile errors happen before the execution of your app. It can be a failed type check, a formatting issue, an unused import, etc. You can easily spot lint/compile errors because EasyCode Flow runs lint and build checks after each edit, catch errors, and display them either in the Chat Panel or in the App Preview.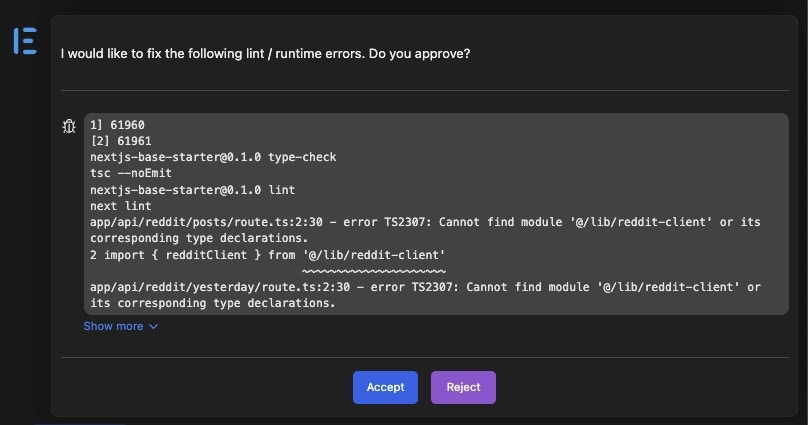
Fix Runtime Errors
Runtime errors happens during the execution of your app. It can be an unhandled exception, a failed network request, etc. You can find them inside server side or client side console logs. To make things easier, EasyCode constantly checks for runtime errors in your logs and display them in the Flow Diagram.- click Fix Error inside the Flow Diagram
- notice it injects runtime logs into your Chat Context with pre-populated prompt
- submit chat
Fix UI Issues
When trying to fix UI issues, provide as much details as possible. You can do so by:- describe in detail via text
- provide an image using Built-in Screenshot or Attach Image
- specify the element using Element Selector
Fix Unexpected Behaviors
Unlike lint or runtime errors, there may not be an explicit error message. Here is an exmaple: Expected Behavior: Click button, modal opens up.Actual Behavior: Click button, nothing shows up. To fix unexpected behaviors:
- describe both what is happening, and what you expect to happen.
- provide runtime log when relevant
- use interactive debugger if prompted
Interactive Debugger
Once you describe the problem to the AI, EasyCode will automatically assess the situation and decide if Interactive Debugger should be activated. When activated, it will ask you to carry out the steps that cause the unexpected behavior.1
Reproduce the problem
This can be simple such as clicking a button, or invovle multiple steps such as loggin in, navigating to a different page, providing some user input, and clicking a submit button.
2
EasyCode records what's happening
As you take these steps, EasyCode will add logpoints inside the relevant functions, tracing code execution end-to-end to determine where things went wrong.
Log points are different from console logs, they do not pollute your code thus do not need to be removed.
3
Click Reproduction Complete
EasyCode adds the relevant log data to context, and tries to fix the problem